

ATMResearch
Join Overfit - free

StatOasis · by Ali Casey

Stop guessing. Start building.

Research, build, test, combine, deploy: the loop that turns trader confidence into conviction.

Get the best trading research in your inbox.

Running a quick security check before this can be sent.

Delivered +2 times a month - when the work is ready, not on a calendar.I'll never sell your address.Unsubscribe in one click, any time.

Turn knowledge into process.|

Happy members

Is this you?

live trading beginsIn-sampletraders' backtestOut-of-sampletraders' realitypeaklive trading beginsIn-sampletraders' backtestOut-of-sampletraders' realityIn-sampletraders' backtestOut-of-sampletraders' realitylossgain
Illustrative: a clean backtest is a hypothesis, not proof.
  • 5,800+read OverFitnewsletter
  • 3,500+members inthe community
  • 23,700+subscriberson YouTube
  • 300+ATM studentsglobally
  • 440+videoson YouTube
  • 30+Q&A video sessionsin the community
  • 40+deep diveresearch articles
  • 5,800+read OverFitnewsletter
  • 3,500+members inthe community
  • 23,700+subscriberson YouTube
  • 300+ATM studentsglobally
  • 440+videoson YouTube
  • 30+Q&A video sessionsin the community
  • 40+deep diveresearch articles

The loop most traders skip three steps of.

Five stages, running as a loop - every live strategy feeds the next round of research. The red shortcut is the one most traders take instead.

Most traders follow this path and call it done.
1

Research

Start from a behavioral hypothesis, not a prediction.

2

Build

Turn the hypothesis into rules, not a curve fit.

3

Robustness test

Out-of-sample, walk-forward, across regimes the optimizer never saw.

4

Portfolio construction

Combine strategies that fail at different times.

5

Live deployment

Size it, monitor it, plan the drawdown before it comes.

Most traders follow this path and call it done.

  1. 1

    Research

    Start from a behavioral hypothesis, not a prediction.

  2. 2

    Build

    Turn the hypothesis into rules, not a curve fit.

    ↷ Most traders follow this path and call it done.

  3. 3

    Robustness test

    Out-of-sample, walk-forward, across regimes the optimizer never saw.

  4. 4

    Portfolio construction

    Combine strategies that fail at different times.

  5. 5

    Live deployment

    Size it, monitor it, plan the drawdown before it comes.

back to research

Can you survive a decade of real markets?

A decade of markets. Five decisions. About eight minutes. See how your instincts hold up against the regimes that broke real strategies, then see the trading personality your choices reveal.

Start: Survive the Decade

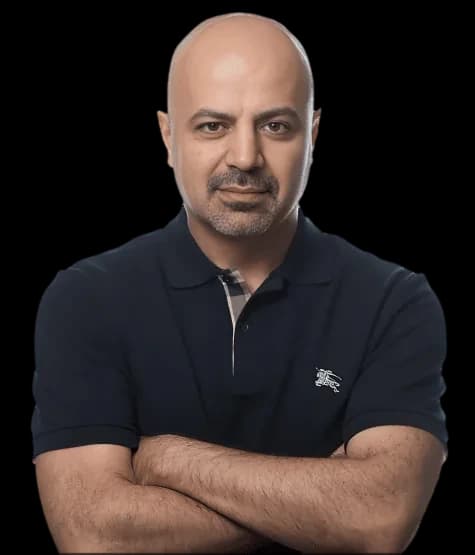
I'm Ali Casey.

I build systematic trading strategies and teach the workflow behind them. Not a content creator. A system builder who happens to teach.

More about me →
Portrait of Ali Casey

Happy Members

5.0
3.5K+

Algo trader since 2014

Here is how I can help you.

Overfit - the newsletter logoOverfit - the newsletter logo

Overfit - the newsletter

Skip the hype. Trust the data. One practical, evidence-driven takeaway per issue: strategy testing, portfolio construction, market structure, and the mechanics behind systematic trading - every claim with the backtest behind it. Publishing since 2024, formerly The AlgoTrader.

Learn more→
Algo Trading Masterclass logoAlgo Trading Masterclass logo

Algo Trading Masterclass

The complete build-a-system workflow, taught end to end: finding an edge, testing it honestly, assembling strategies into a portfolio, and putting it live - the same process behind every study I publish. Currently open as a waitlist.

Learn more→

Community

Where builders share strategies, code, and feedback. Get plugins, correlation book, indicators and more. Free to join today.

Learn more→

Digital Products

Everything you can download and use the same day: books, strategy packs, and tools - starting with 36 Ways to Buy the Dip, backtested mean-reversion entries for systematic dip-buying, every variant tested, every result shown. Listed on the products page with everything else StatOasis makes.

Learn more→
AlgoChef logoAlgoChef logo

AlgoChef

The validation layer I built for the step most traders skip: pressure-testing a strategy before it risks real money. Launched 2026.

Learn more→

Latest from StatOasis YouTube channel

Almost Everyone Draws The NR4 Pattern Wrong

Almost Everyone Draws The NR4 Pattern Wrong

Aug 31, 2026

The "Dumb Money" Beat the Smart Money (4,889 Backtests)

The "Dumb Money" Beat the Smart Money (4,889 Backtests)

Aug 3, 2026

I Analyzed Every SPY Gap Since 1993. Here's What I Found.

I Analyzed Every SPY Gap Since 1993. Here's What I Found.

Jul 20, 2026

Latest from StatOasis X channel

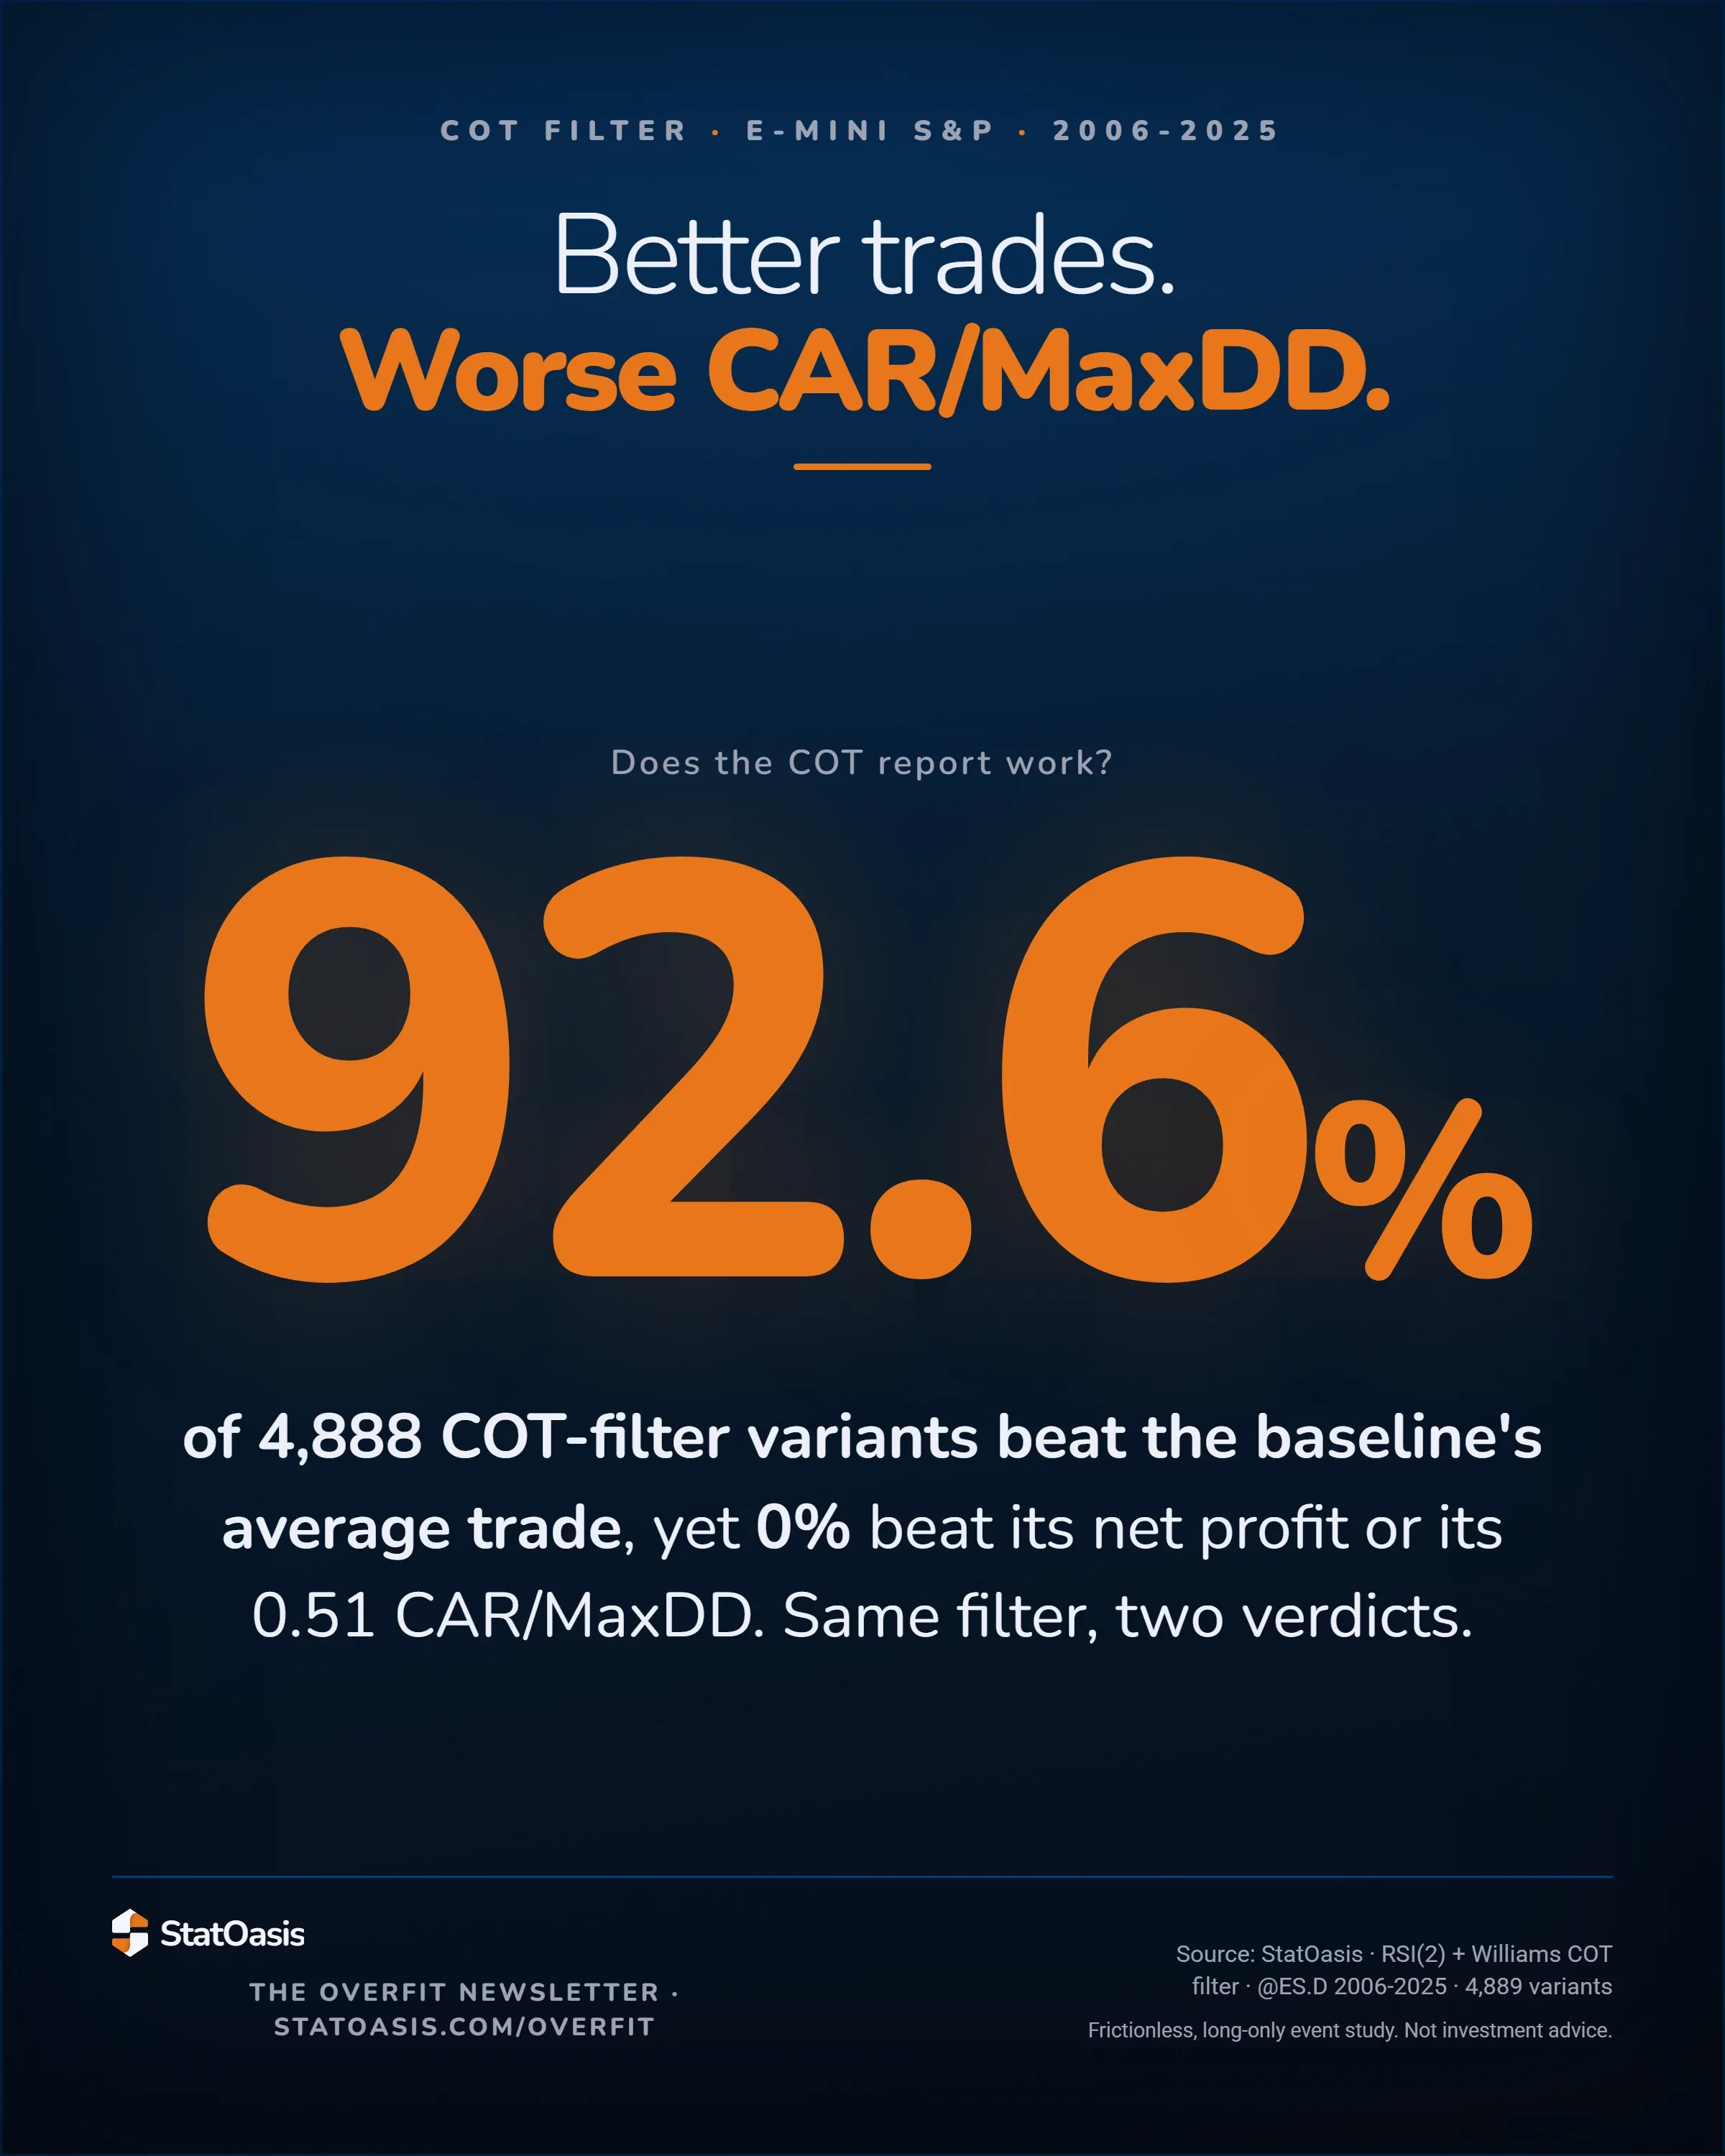
StatOasis card. ICT won the contest. It still lost to doing nothing . 81.5% of order-block variants beat a coin flip on SPY; 0.0% of all 648 variants beat buy-and-hold. Order blocks led every family on net profit — and still lost to the index. No entry, ICT or simple, beat buy-and-hold on any of the four markets.

Of 7 entry families we backtested across 4 markets, exactly one beat a coin flip in a majority of its variants everywhere: Order blocks. 81.5% on SPY, 66.7% DIA, 59.3% QQQ, 55.6% IWM. That's ICT's most defensible concept — a real, modest, cross-market signal. It still never beat buy-and-hold. Anywhere. 648 backtests: https://statoasis.com/overfit/research/ict-backtest-what-survives

Sep 10, 2026 · 51 impressions
StatOasis card. 648 backtests. Zero beat buy and hold. A single figure 0 fills the card as the standout, above the line 0 of 648 backtests beat buy-and-hold across 4 markets and 7 entries. Nearly every variant was profitable. Not one beat the index it traded.

I backtested ICT / Smart Money Concepts. Mechanically. 648 backtests across 4 markets. Order blocks, fair value gaps, liquidity sweeps, Optimal Trade Entry — versus 3 boring entries, a coin flip, and buy-and-hold. What survived: 🧵

Sep 9, 2026 · 87 impressions · 3 reactions
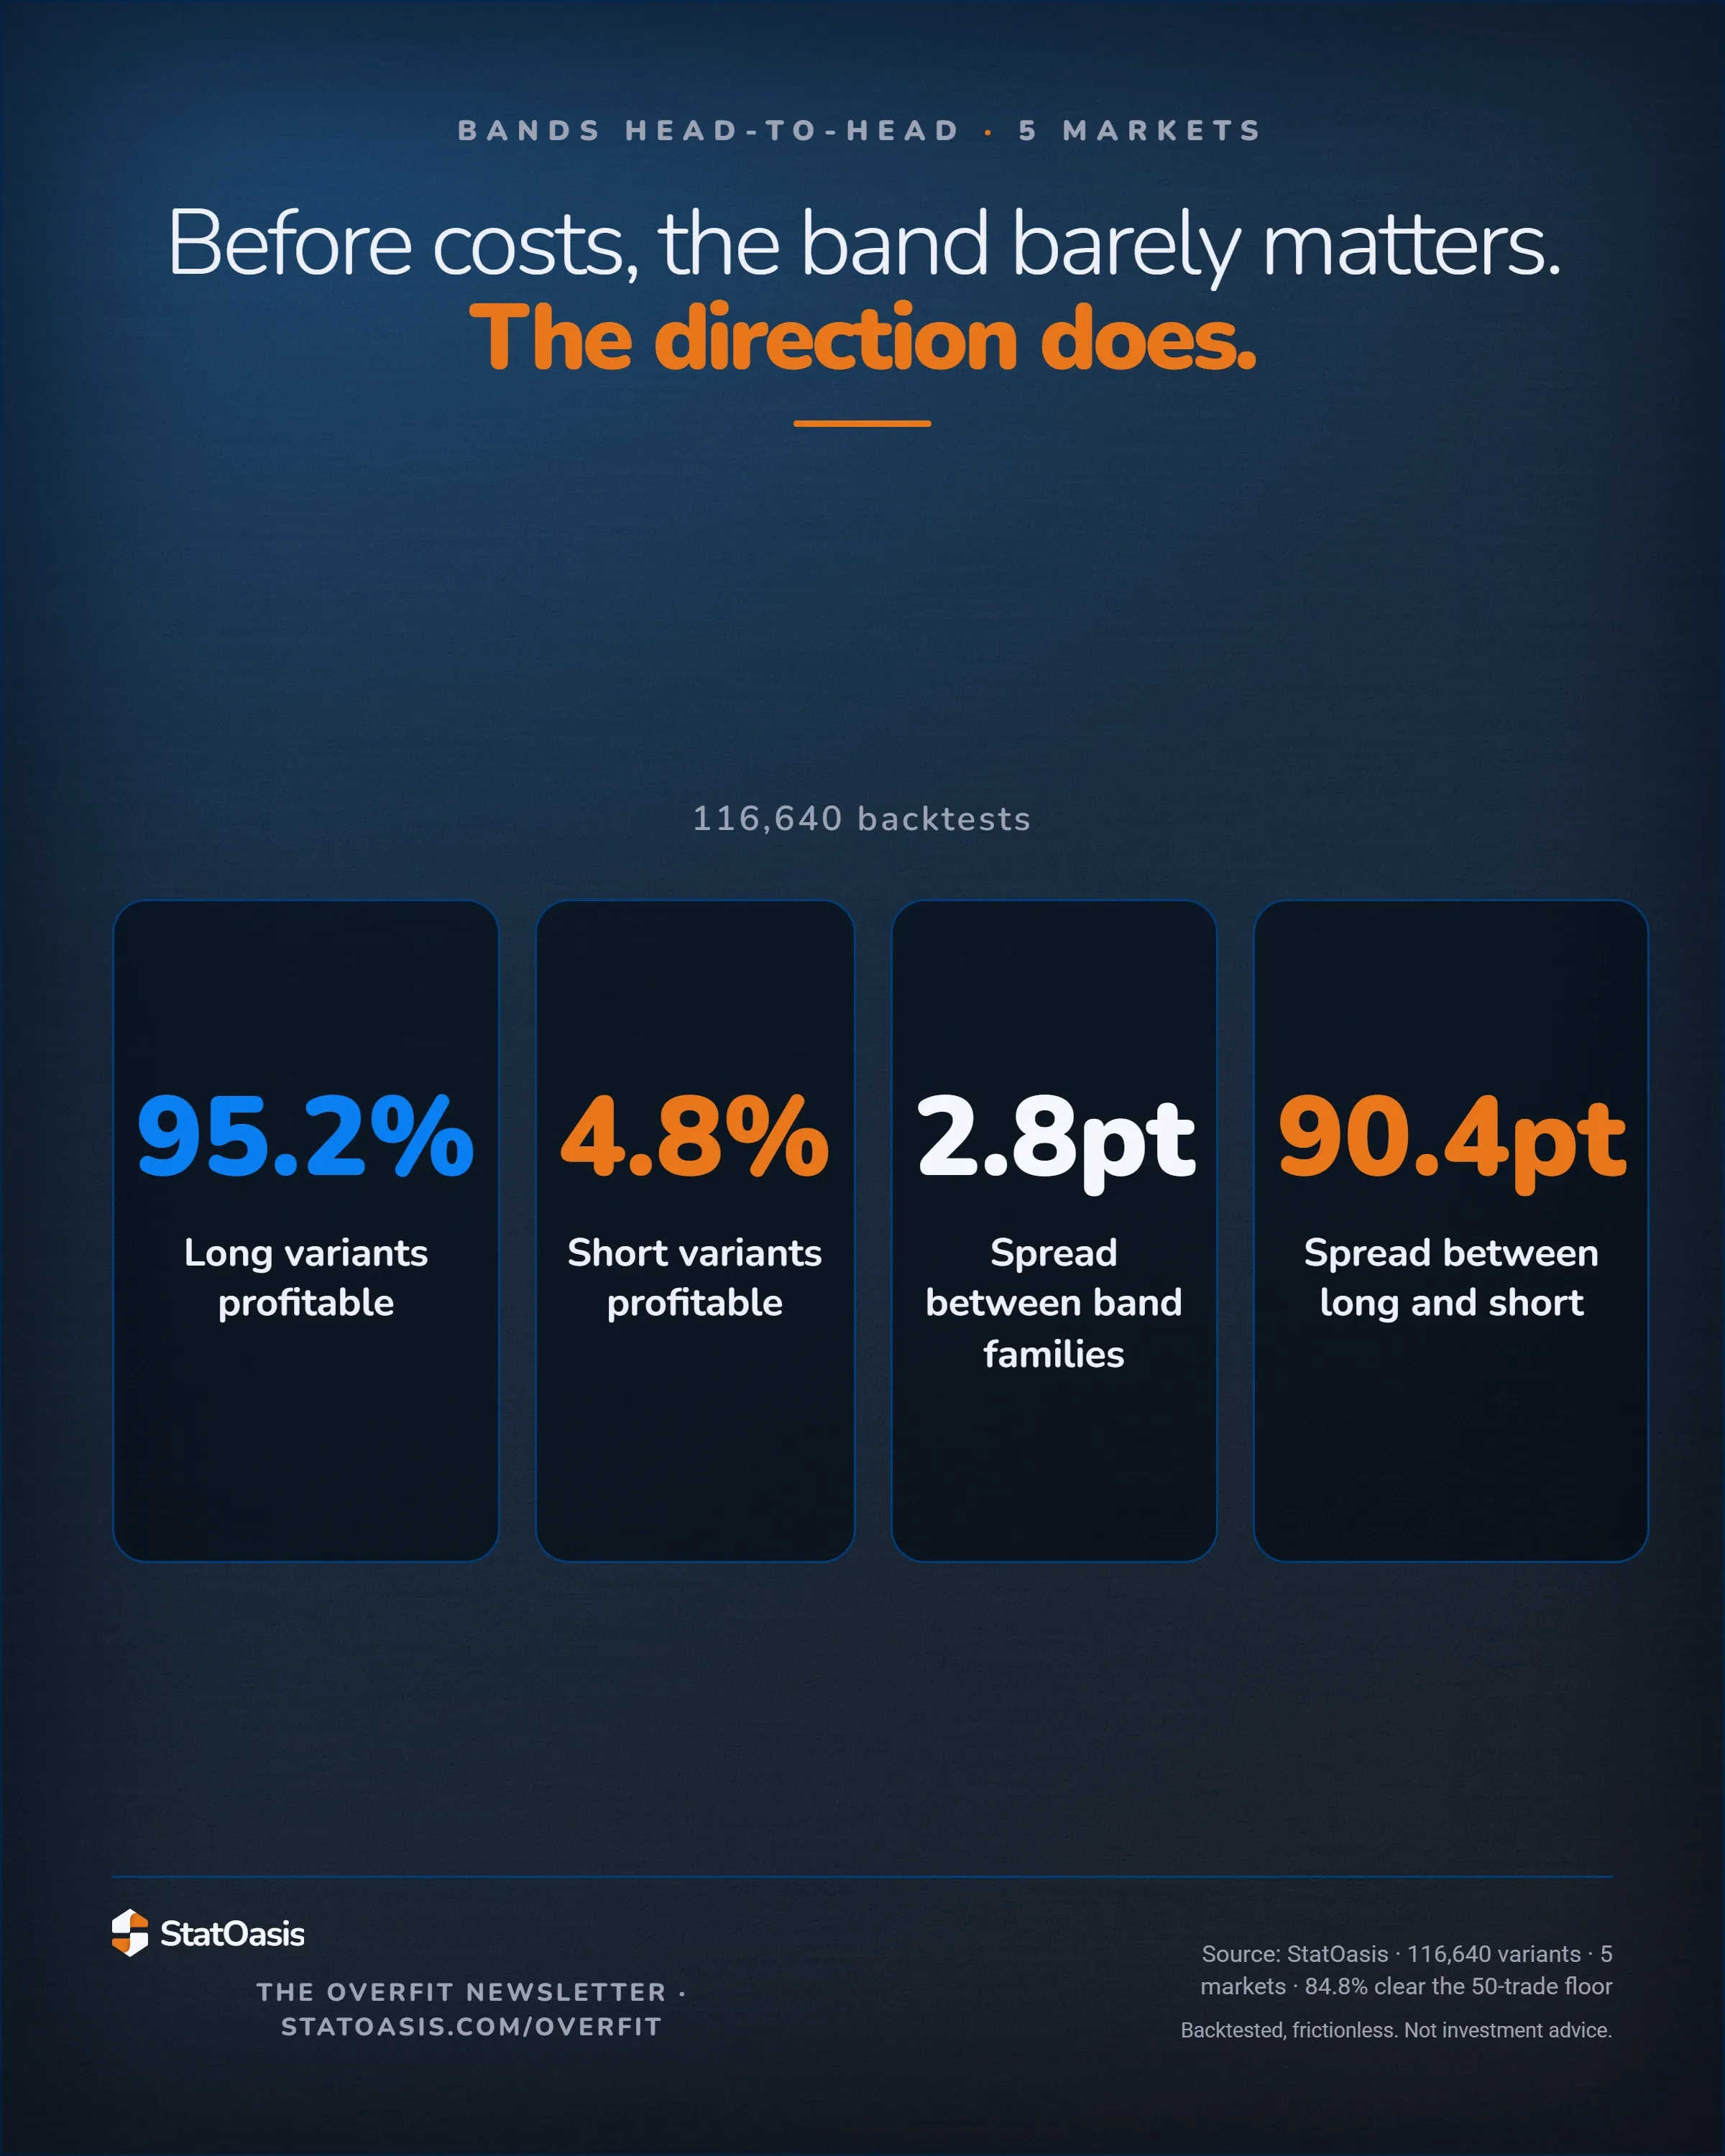
Card headlined 'The margin is a fraction of a per cent. Every figure here is frictionless.', subtitled median average trade, each setting as published. Three tiles: 0.39% for the long signal on a high pivot held 10 bars, profitable on 8 of 8 markets, singled out as the best of the three and still thin; 0.24% for the long signal on a low pivot held 10 bars, profitable on 6 of 8; and 0.21% for the short signal on a low pivot held 4 bars, profitable on 6 of 8, both held plain. Callout: no commission, no slippage, no spread anywhere in this study, and the winning configurations average a fraction of a per cent per trade, which is the range where costs decide the outcome.

17,424 backtests, and here is what they cannot tell you. Every figure in my Crabel rebuild is frictionless. No commission, no slippage, no spread. The winning settings average a fraction of a per cent per trade. That is where your costs decide it. https://statoasis.com/overfit/research/unveiling-toby-crabel-s-up-down-thrust-trading-patterns

Sep 8, 2026 · 86 impressions · 3 reactions

Latest from LinkedIn

Card headlined 'No signal here uses a bar that had not happened yet.', subtitled the control, before any result. Three tiles: 2, the right-hand bars a pivot waits for before it counts, singled out as the rule the whole study rests on, with the setting left 4, right 2, lookback 20, window 15; 936 of 3,024 grid variants clear the 50-trade floor, marked as a count of a different kind, with 2,088 flagged and 0 dropped; and 193 instrument-years across 8 markets, held plain, with SPY back to 1993 at 8,398 daily bars. Callout: a pivot high is only the highest bar around once the bars after it have printed, publish it one bar early and the backtest turns profitable for free, so here the pivot waits and every fill is the open of the bar after a completed thrust.

A pivot is a claim about the future, and that is what makes pivot backtests so easy to fake. A pivot high is only the highest bar around once the bars after it have printed. Publish it one bar early and your backtest turns profitable for free, along with every other pivot strategy ever written. So before any result in my Toby Crabel thrust rebuild, here is the control that makes the rest of it worth reading. The study publishes a pivot only after its right-hand bars exist, two bars late in the headline setting and never earlier, and every fill is at the next bar's open. Then it proves the rule by truncation: the signal at every bar is recomputed with the entire future deleted, and it has to come out identical. Any bar whose verdict changed would fail the build. The scale on top of that: Eight markets, two of them chosen specifically because the pattern has no business working there. ES, NQ, SPY, QQQ, DIA and IWM, plus natural gas and Japanese yen futures. 193 instrument-years, with SPY back to 1993 at 8,398 daily bars. 2,024 thrust events, 1,182 up and 842 down. 17,424 backtested variants: 3,024 in the results grid, 14,400 in the parameter sweep. A 50-trade reliability floor, which 936 of the 3,024 grid variants clear. The rest are flagged, never dropped. Frictionless throughout, $35,000 fixed capital, no compounding, one position at a time. Adding the two markets that should not work cost nothing, and they are what turned "this is a pattern" into "this is stock-index exposure". Methodology and full results: https://statoasis.com/overfit/research/unveiling-toby-crabel-s-up-down-thrust-trading-patterns

Sep 10, 2026
StatOasis card. I backtested ICT — mechanically. 648 backtests. Zero beat buy & hold. 0 of 648 backtests beat buy-and-hold.

"Fair value gaps get filled — that's the edge." I measured it. Both halves. Bullish FVG retrace events on SPY since 1993: 1,122. Gaps do get revisited, constantly. That half is true. The average 5-day return after price fills the gap: -0.005% versus the market's ordinary drift. T-stat: -0.08. Statistically zero. The market wanders into the gap, then does exactly what it always does. The fill is real. The tradable meaning attached to it is not — at least not on daily bars, where anyone can check. This is the pattern with most trading folklore: the observation survives scrutiny, the story attached to the observation does not. "Gaps fill" was never the claim that made money. "Gaps fill because institutions leave footprints, and you can trade the footprint" was — and that half did not survive a t-test. Full forward-edge tables for all four ICT concepts: https://statoasis.com/overfit/research/ict-backtest-what-survives

Sep 10, 2026
Grouped bar chart of six markets showing how often each OBV construction produced a better profit factor than its control, with the replacement swinging from 16 percent on IWM to 65 on QQQ while the confirmed version stays between 45.7 and 88.3 percent.

Here is how to tell whether an indicator result is real, using one chart and no statistics. Run the same test on several markets. Then look at the spread. I did this with the OBV MACD. Six markets, and for each one the share of matched backtest pairs where the OBV version beat the plain MACD version it was paired against: QQQ 65% NQ 59% DIA 58% SPY 34% ES 34% IWM 16% QQQ and IWM are both US equity index ETFs. Same country, same exchanges, same macro, same decades. And the verdict almost completely reverses between them. That is what a result looks like when it belongs to a history rather than to an indicator. Test first on QQQ and you publish a confident article. Test first on IWM and you conclude the thing is broken. Both ran a real backtest. Both read noise. The same chart shows the alternative. The confirmed version, where OBV vetoes a MACD crossover rather than replacing it, runs from 45.7% on its worst market to 88.3% on its best and clears the coin flip on five of six. Half the spread, and it never collapses. Nothing in that comparison required a p-value. It required running the test more than once. Three practical versions of the same rule: Run the mirror. If your long filter works, test the short one. A filter that only helps on the side of a thirty-year uptrend has not been shown to filter anything. Run the second market. Not a second date range on the same market. A different instrument. Report the spread, not the best cell. A single best row exists for every claim anyone wants to make. Six markets, 9,216 backtests, and the spread reported for every finding: https://statoasis.com/overfit/research/obv-macd-vs-traditional-macd-which-one-wins

Sep 9, 2026

What you won't find here.

No trade calls. No daily predictions. No PnL screenshots. This is for traders who want to understand how to build trading systems, how they behave in different market regimes, when they break, and why. If that's not you, there are plenty of other places, and no hard feelings.

What traders say.

rodolfo berrocal's photo

rodolfo berrocal

Hello, my name is Rodolfo Berrocal, I'm from Lima, Peru. I just stopped by to thank you for all the great work you do. I'm doing my best to understand your videos since I don't speak English very well, but I'm still learning a lot from you. I'm just getting started in the world of algorithmic trading, and it's going well for me. Thank you again, and blessings.

Tommy's photo

Tommy

Dear Ali, your attention to detail - and people - was always bar none. No question, you are our Financial Guru, while also a loving/caring figure so you deserve our utmost respect! Thank you for all your shared experience and everyday hard work for our not-only-financial wellfare! :)

Chad's photo

Chad

I’ve been in the program since Feb, have found a way to create and find a lot of pretty good algos, but magic sauce happens when we combine the uncorrelated “pretty goods”. Happy to report since Feb, up 28pct and am now in maintenance mode working on the process instead of reflexively reacting to every draw down that I think is the end of the world. Biggest learnings. Test for worst case portfolio drawdown, size accordingly. Trade top strategies within that portfolio, cycle out worst performers every few months. Seems to be a winning recipe and am so excited to think about the next chapter in this journey I’ve been on for many many moons 😃

Read more →

StatOasis is calm, evidence-based algorithmic-trading education, founded by Ali Casey. Ali builds systematic trading strategies and teaches the workflow behind them: research, build, test, combine, deploy. He writes the Overfit newsletter, published since 2024, and runs the Algo Trading Masterclass.

Socials

  • X ↗
  • YouTube ↗
  • Instagram ↗
  • LinkedIn ↗
  • GitHub ↗
  • Muck Rack ↗
  • LinkedIn SO ↗
  • GitHub SO ↗

Products

  • Overfit - the newsletter
  • Algo Trading Masterclass
  • StatOasis Community
  • 36 Ways to Buy the Dip
  • AlgoChef ↗

Reading & tools

  • Research
  • Methodology
  • Survive the Decade
  • Wall of Love

StatOasis

  • About Ali Casey
  • Contact
© 2026 StatOasis. Calm, evidence-based.
PrivacyTermsHypothetical resultsCalifornia