

36 Ways to Buy the Dip · The 40 Entries
4.1 RSI
The two-period RSI below 10. This is the most recognised mean reversion entry there is, and on this data it earns the reputation: 440 trades, a profit factor of 1.61, and a verdict of Strong.
Where it came from
RSI is commonly attributed to J. Welles Wilder Jr., who published it as a 14-period momentum gauge. This book flags that credit as unconfirmed rather than citing it, because no checked copy of the original was at hand, and an origin claim without one is a rumour with a date on it. The origin isn't what matters here anyway. What matters is the shorter window. At 14 periods RSI is a slow momentum reading. At two periods a single down close swamps the average and the reading drops toward zero, which turns it into something close to a pure short-term oversold signal. It's a different tool wearing the same name.
How it works
Wilder's smoothing separates up closes from down closes and reports the ratio between them on a 0 to 100 scale. With a two-bar window, two down closes in a row will drive it under 10 almost no matter how large they were.
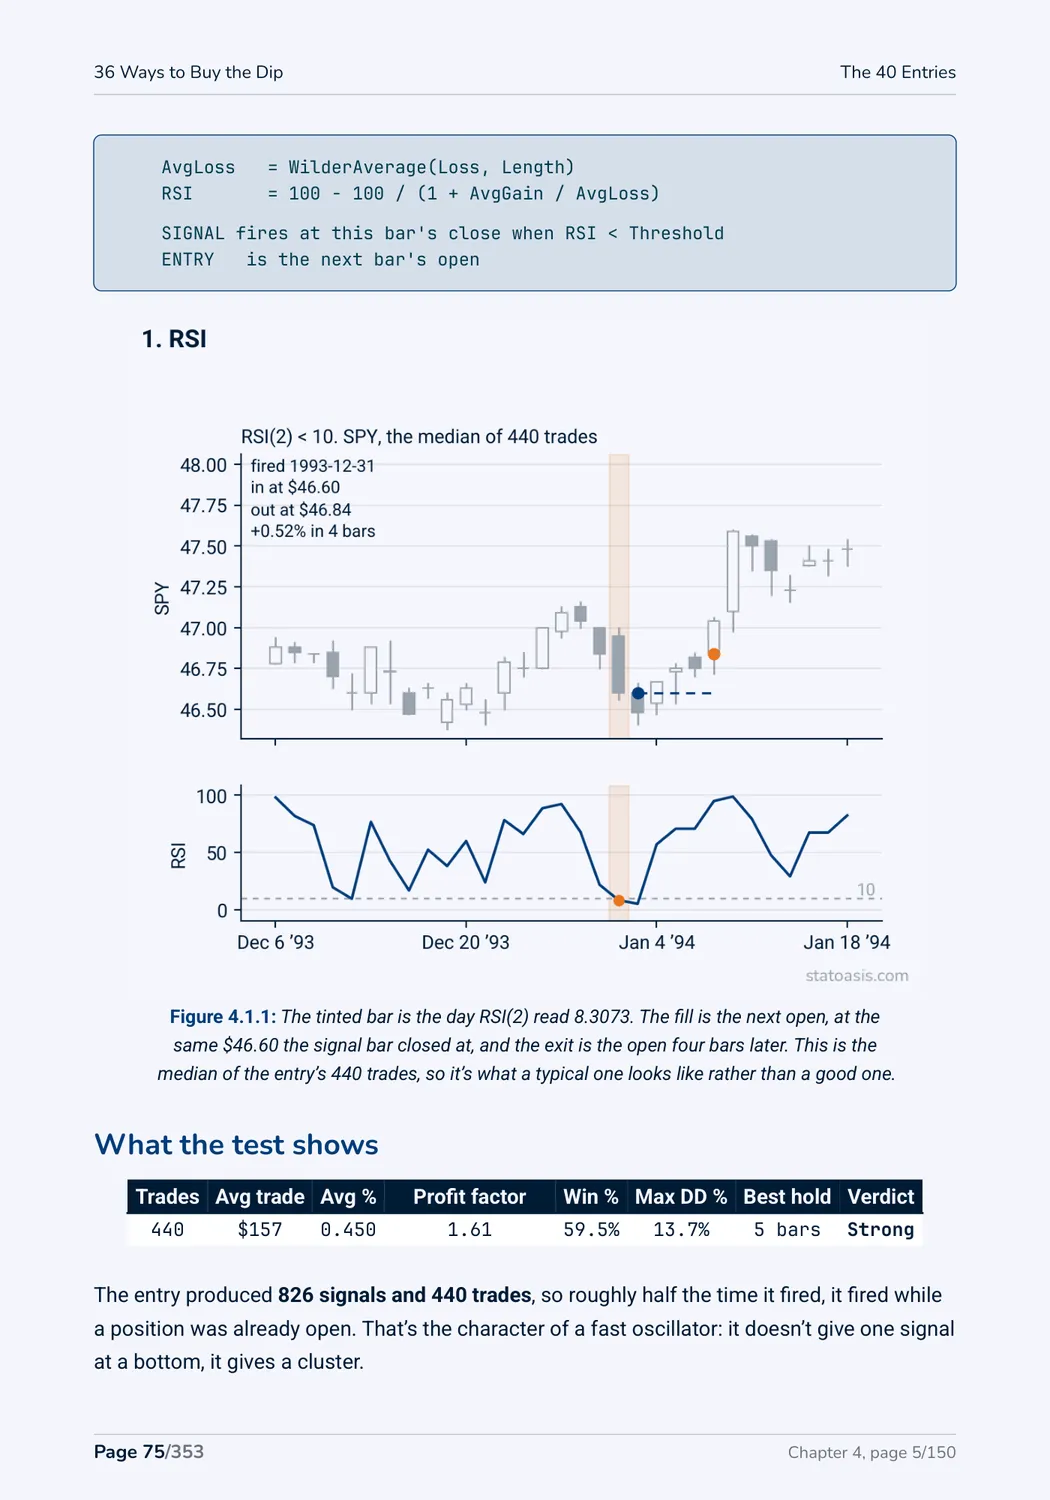
Here's one, and it's the median trade this entry produced, so it's neither its best day nor its worst.
On December 31, 1993 SPY closed at $46.60 and RSI(2) read 8.3073, under the threshold of 10. The signal was known at that close, so the fill was the next session's open: January 3, 1994 at $46.60. At $35,000 that's 751 shares. Four bars later, on January 7, the trade sold at the open, $46.84. It made $180, or +0.515%.
Note what the fill cost this time: nothing. SPY opened exactly where it had closed, so the overnight gap took $0.00. Don't count on that. The next page's median trade gave up more than a percent of the price overnight before it started. That's not a fault in the test, it's the honest order of events, and it's one reason a rule tested on closing prices makes itself look better than it is.
SETTINGS: Length = 2 bars, Threshold = 10

FOR EACH BAR:
    Change    = Close - Close[1]
    Gain      = Change if Change > 0 else 0
    Loss      = -Change if Change < 0 else 0
    // Wilder, 1/n
    AvgGain   = WilderAverage(Gain, Length)
    AvgLoss   = WilderAverage(Loss, Length)
    RSI       = 100 - 100 / (1 + AvgGain / AvgLoss)

    SIGNAL fires at this bar's close when RSI < Threshold
    ENTRY   is the next bar's open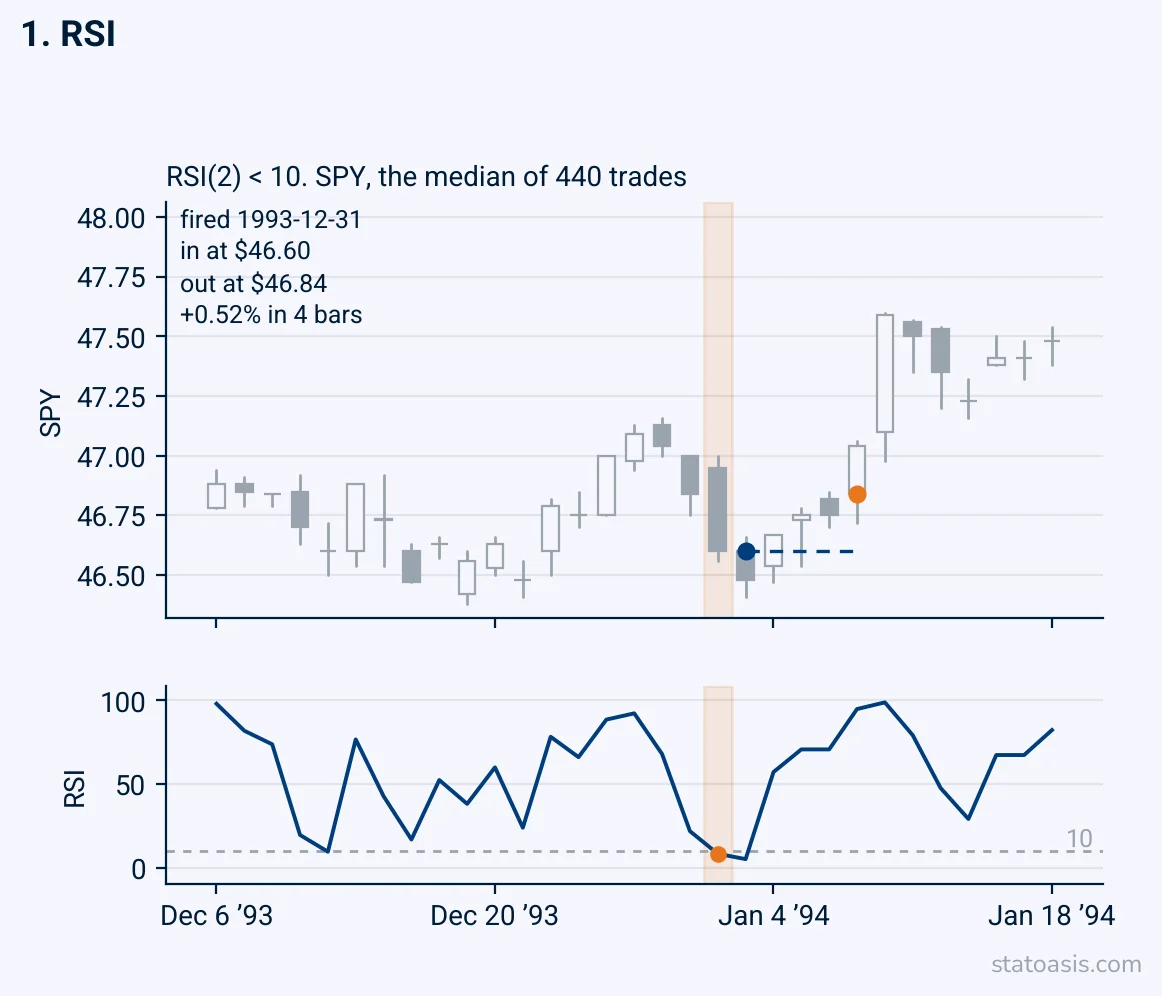
What the test shows
| Trades | Avg trade | Avg % | Profit factor | Win % | Max DD % | Best hold | Verdict |
|---|---|---|---|---|---|---|---|
| 440 | $157 | 0.450 | 1.61 | 59.5% | 13.7% | 5 bars | Strong |
The entry produced 826 signals and 440 trades, so roughly half the time it fired, it fired while a position was already open. That's the character of a fast oscillator: it doesn't give one signal at a bottom, it gives a cluster.
The number worth pausing on is the drawdown. Four of the nine ranked entries in this block hold their worst loss under 15%, and this is one of them at 13.7%, behind CCI at 10.4% and Williams %R at 11.9% and just ahead of TSI at 14.0%. The other five run from Stochastic's 16.0% all the way to 45.0%. Most entries in this block buy their profit factor with a deeper hole. This one doesn't, and that combination is rarer than the popularity of RSI(2) would suggest.
Does the number they picked matter
How to read this table, here and wherever it appears. Each row is the same entry at a different trigger level, on SPY at the 4-bar hold, and "(shipped)" marks the level the first edition used. Look for a run of nearby rows with a similar profit factor around the shipped one: a setting inside such a run doesn't depend on luck, and one on a lone peak does. Total $ and Ret/DD show the same rows as total profit and as total profit divided by the worst fall. Edge is edge over drift.
| Trigger | Trades | PF | Avg trade | Total $ | Ret/DD | Edge | Verdict |
|---|---|---|---|---|---|---|---|
| 5.0 | 224 | 1.45 | 0.380% | $29,579 | 2.79 | +0.222% | Edge present |
| 7.5 | 341 | 1.58 | 0.450% | $53,789 | 5.06 | +0.292% | Strong |
| 10.0 (shipped) | 440 | 1.61 | 0.450% | $69,011 | 5.58 | +0.292% | Strong |
| 20.0 | 733 | 1.56 | 0.380% | $97,301 | 8.51 | +0.222% | Strong |
| 30.0 | 920 | 1.44 | 0.300% | $97,974 | 7.26 | +0.142% | Edge present |
This is what a well-chosen setting looks like. From 7.5 through 20 the profit factor stays between 1.56 and 1.61, and the shipped 10 sits at the top of that stretch. Tighten to 5 and you lose half the trades and the edge goes with them, down a band to Edge present. Loosen to 30 and it decays again, because a reading of 30 on a two-period RSI is an ordinary down day rather than an oversold one. Ten sits inside the flat stretch, which is the right place for a threshold to sit: the settings either side of it barely move the result.
The holding period is the more interesting axis.
| Hold | Trades | PF | Avg trade | Total $ | Ret/DD | Edge |
|---|---|---|---|---|---|---|
| 0 bars | 826 | 1.35 | 0.140% | $38,911 | 7.16 | +0.134% |
| 1 bar | 577 | 1.30 | 0.140% | $28,886 | 2.76 | +0.099% |
| 2 bars | 508 | 1.58 | 0.340% | $60,034 | 7.52 | +0.260% |
| 3 bars | 462 | 1.49 | 0.330% | $52,772 | 4.69 | +0.211% |
| 4 bars | 440 | 1.61 | 0.450% | $69,011 | 5.58 | +0.292% |
| 5 bars | 417 | 1.88 | 0.630% | $91,284 | 7.58 | +0.433% |
| 10 bars | 337 | 1.74 | 0.770% | $90,794 | 8.80 | +0.380% |
| 20 bars | 233 | 1.75 | 0.870% | $70,906 | 4.13 | +0.092% |
- 0 bars+0.134%
- 1 bar+0.099%
- 2 bars+0.260%
- 3 bars+0.211%
- 4 bars+0.292%
- 5 bars+0.433%
- 10 bars+0.380%
- 20 bars+0.092%
Five bars is the peak at +0.433% over drift, ten is close behind at +0.380%, and four, the book's comparison hold, trails both at +0.292%. Five to ten bars is a broad region, and a broad region is worth far more than a peak, because it means the result doesn't depend on getting the exit exactly right. The 20-bar row is the warning: the average trade is 0.870%, the biggest in the column, and the edge over drift has shrunk to +0.092%. Hold this entry for a month and the market pays you nearly all of the return.
Where it goes wrong
This table ranks every signal the entry gave, including signals the flat-only backtest skipped because a trade was already open, by the return from the fill to the close five bars later. The last column counts how many of the 40 signalled on that bar.
| Entry date | Entry price | 5-bar return from the fill | Lowest low in 20 bars | Entries signalling that day |
|---|---|---|---|---|
| 2011-08-01 | $130.84 | -14.20% | -15.72% | 20 of 40 |
| 2020-03-13 | $263.09 | -13.03% | -17.04% | 29 of 40 |
| 2008-11-13 | $86.13 | -12.40% | -13.69% | 23 of 40 |
Read the last column before the others. On all three of the worst days this entry ever had, half the catalog fired alongside it. These aren't RSI's failures, they're the market's, and no oversold reading was going to help you on March 13, 2020.
That's the useful pattern and it holds across most of this chapter. A fast oscillator's worst trades are crashes, and crashes are exactly when everything looks oversold at once. Chapter 6 measures how much that clustering actually costs a portfolio.
One coding trap. If there's no down close in the window, average loss is zero and the division would fail. The guard returns 100, so no signal fires, which is correct: an unbroken run of up closes is not oversold. A port that returns zero there will fire on the strongest bars in the file.